Final Exam Results
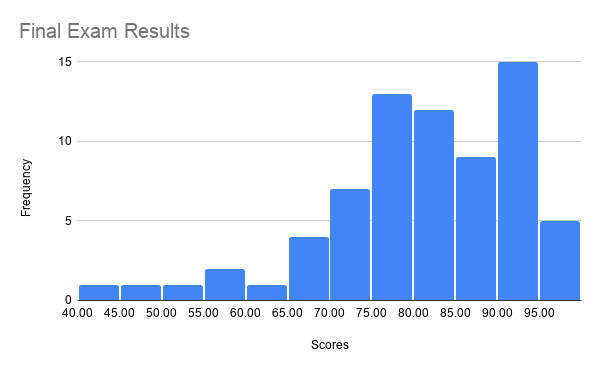
Students can email me directly for final exam scores and grades.
| Mean | 84.7 |
| Median | 88.9 |
| Mode | 95.0 |
| Standard Deviation | 11.8 |
| Range | 56.7 |
| Minimum | 40.2 |
| Maximum | 96.9 |
| Sum | 8130 |
| Count | 96 |

Category: f19-busad265
Students can email me directly for final exam scores and grades.
| Mean | 84.7 |
| Median | 88.9 |
| Mode | 95.0 |
| Standard Deviation | 11.8 |
| Range | 56.7 |
| Minimum | 40.2 |
| Maximum | 96.9 |
| Sum | 8130 |
| Count | 96 |

Review:
Presentation:
Review:
Presentation:
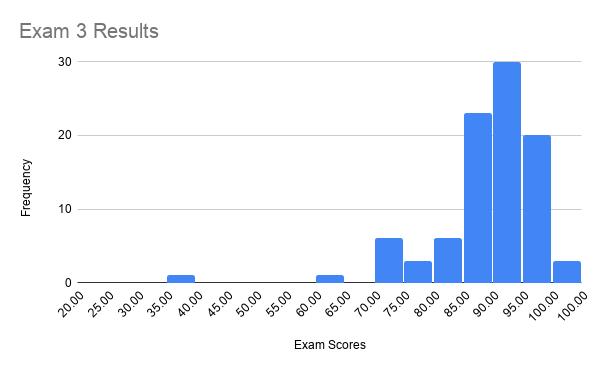
| Mean | 82.8 |
| Median | 90.0 |
| Mode | 95.0 |
| Standard Deviation | 24.4 |
| Range | 100.0 |
| Minimum | 0.0 |
| Maximum | 100.0 |
| Sum | 8275.9 |
| Count | 100 |

Review:
Presentation:
Activity:
Review:
Presentation:
| Presidential Election Year | Time Period | Ballots Cast (thousands) |
| 2004 | 1 | 68.4 |
| 2008 | 2 | 73.9 |
| 2012 | 3 | 77.7 |
| 2016 | 4 | 78.7 |
Activity:
| Price of Coffee ($ per pound) | Deforestation (%) |
| 0.29 | 0.49 |
| 0.40 | 1.59 |
| 0.54 | 1.69 |
| 0.55 | 1.82 |
| 0.72 | 3.10 |
Review:
Presentation:
Activity:
| x | y |
| 10 | -30 |
| 3 | -2 |
| 5 | -10 |
| 1 | 6 |
| 6 | -14 |
| Femur (cm) | Humerus (cm) |
| 38 | 41 |
| 56 | 63 |
| 59 | 70 |
| 64 | 72 |
| 74 | 84 |
Review:
Presentation:
Activity: Submit this work before leaving class!!
| Presidential Election Year | Time Period | Ballots Cast |
| 2004 | 1 | 68,371 |
| 2008 | 2 | 73,881 |
| 2012 | 3 | 77,671 |
| 2016 | 4 | 78,652 |
Assignment:
Review:
Presentation:
Activity:


Problems above from the Against All Odds video series guide for Unit 10.
Review:
Presentation:
Activity:
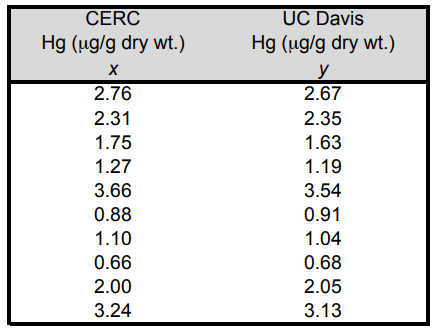
Problem 1. A study was conducted on mercury (Hg) concentrations in fish taken from Lake Natoma in California. The researchers were concerned that mercury concentration levels in sample fish tissue might differ depending on the lab testing the fish. Fish tissue samples from 10 largemouth bass were sent to two labs, Columbia Environmental Research Center (CERC) and University of California, Davis (UC Davis), for inter-laboratory comparison. Mercury concentration is measured in micrograms of mercury per gram of fish tissue (dry weight). Use the mercury concentration data below to create a Scatterplot and characterize the nature of any correlation.

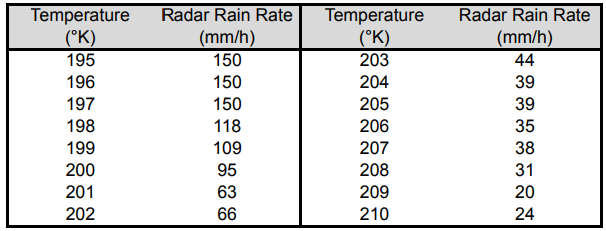
Problem 2. Satellites are one of the many tools used for predicting flash floods, heavy rainfall, and large amounts of snow. Geostationary Operational Environmental Satellites (GOES) collect data on cloud top brightness temperatures (measured in degrees Kelvin (°K)). It turns out that colder cloud temperatures are associated with higher and thicker clouds, which could be associated with heavier precipitation. Data consisting of cloud top temperature measured by a GOES satellite and rainfall rate measured by ground radar appear in the table below. Because ground radar can be limited by location and obstructions, having an alternative for predicting the rainfall rates can be useful. Use the temperature and radar rain rate data below to create a Scatterplot and characterize the nature of any correlation.

Problems copied from the Against All Odds video series guide for Unit 10.