Geography of the Pueblo Real Estate Market – Summer 2014 Snapshot
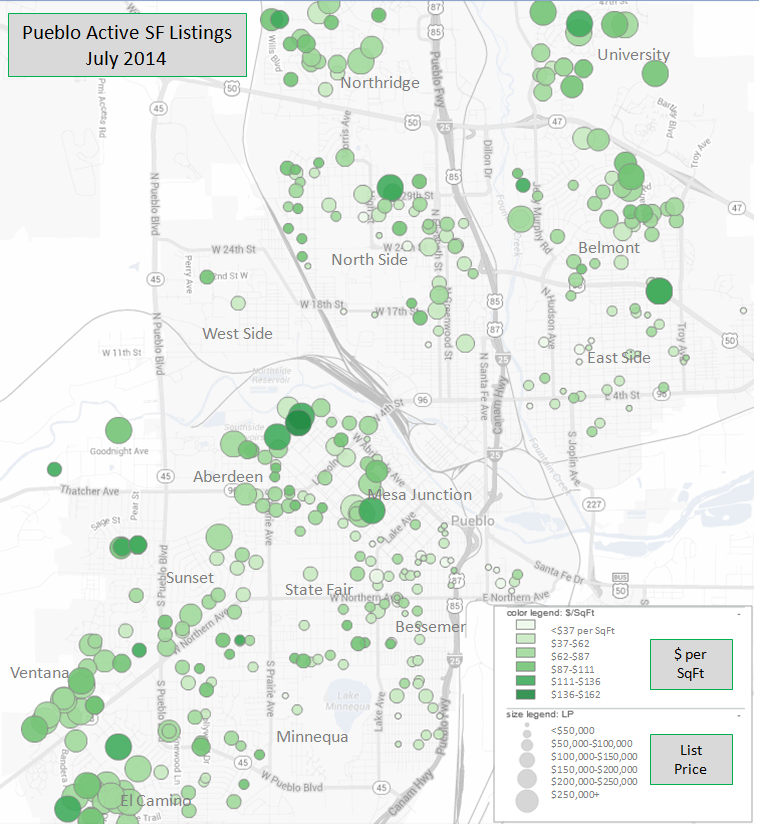
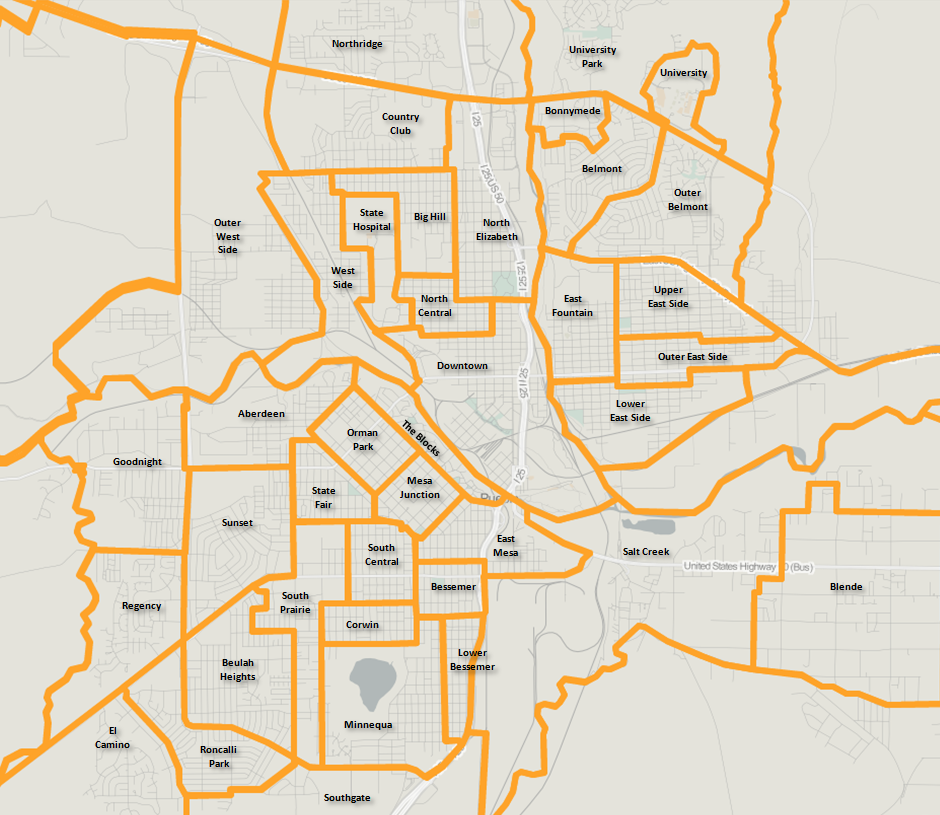
Here’s a map I produced to help illustrate some of the neighborhood characteristics of the Pueblo Real Estate market. In a recent post I produced a partition of Pueblo Neighborhoods based on Census geography. I don’t yet have the census polygons embedded in TerraSeer’s interactive mapping system but they should arrive before long, probably this fall. In the meantime, I produced a map of all single-family homes currently for sale in Pueblo. You’ll note I excluded Pueblo West and Pueblo County properties to focus on Pueblo’s urban core. I also omitted any property without at least 2 bedrooms and 1 bath and 500 square feet. This keeps some of the dubious listings off the list.

To help illustrate how real estate varies by neighborhood I’ve used color to indicate price per square foot (darker green means higher price per square foot). I’ve also used symbol size to indicate list price (larger circle means higher list price). So, essentially, big dark green circles represent higher priced neighborhoods and small lightly shaded circles represent lower priced neighborhoods. Key neighborhoods are labeled.
