Lesson 8: Sampling Distributions and the Central Limit Theorem
September 25, 2019
Review:
- Exam 1 Results
- Design of Experiments
- Census and Sampling
- Sampling and Surveys
Presentation:
- Sampling Distributions
- Take multiple Simple Random Samples, sample size = n, and calculate each sample mean
- “Sampling Distribution” is the distribution of sample means
- Standard deviation of sample means = s/√n
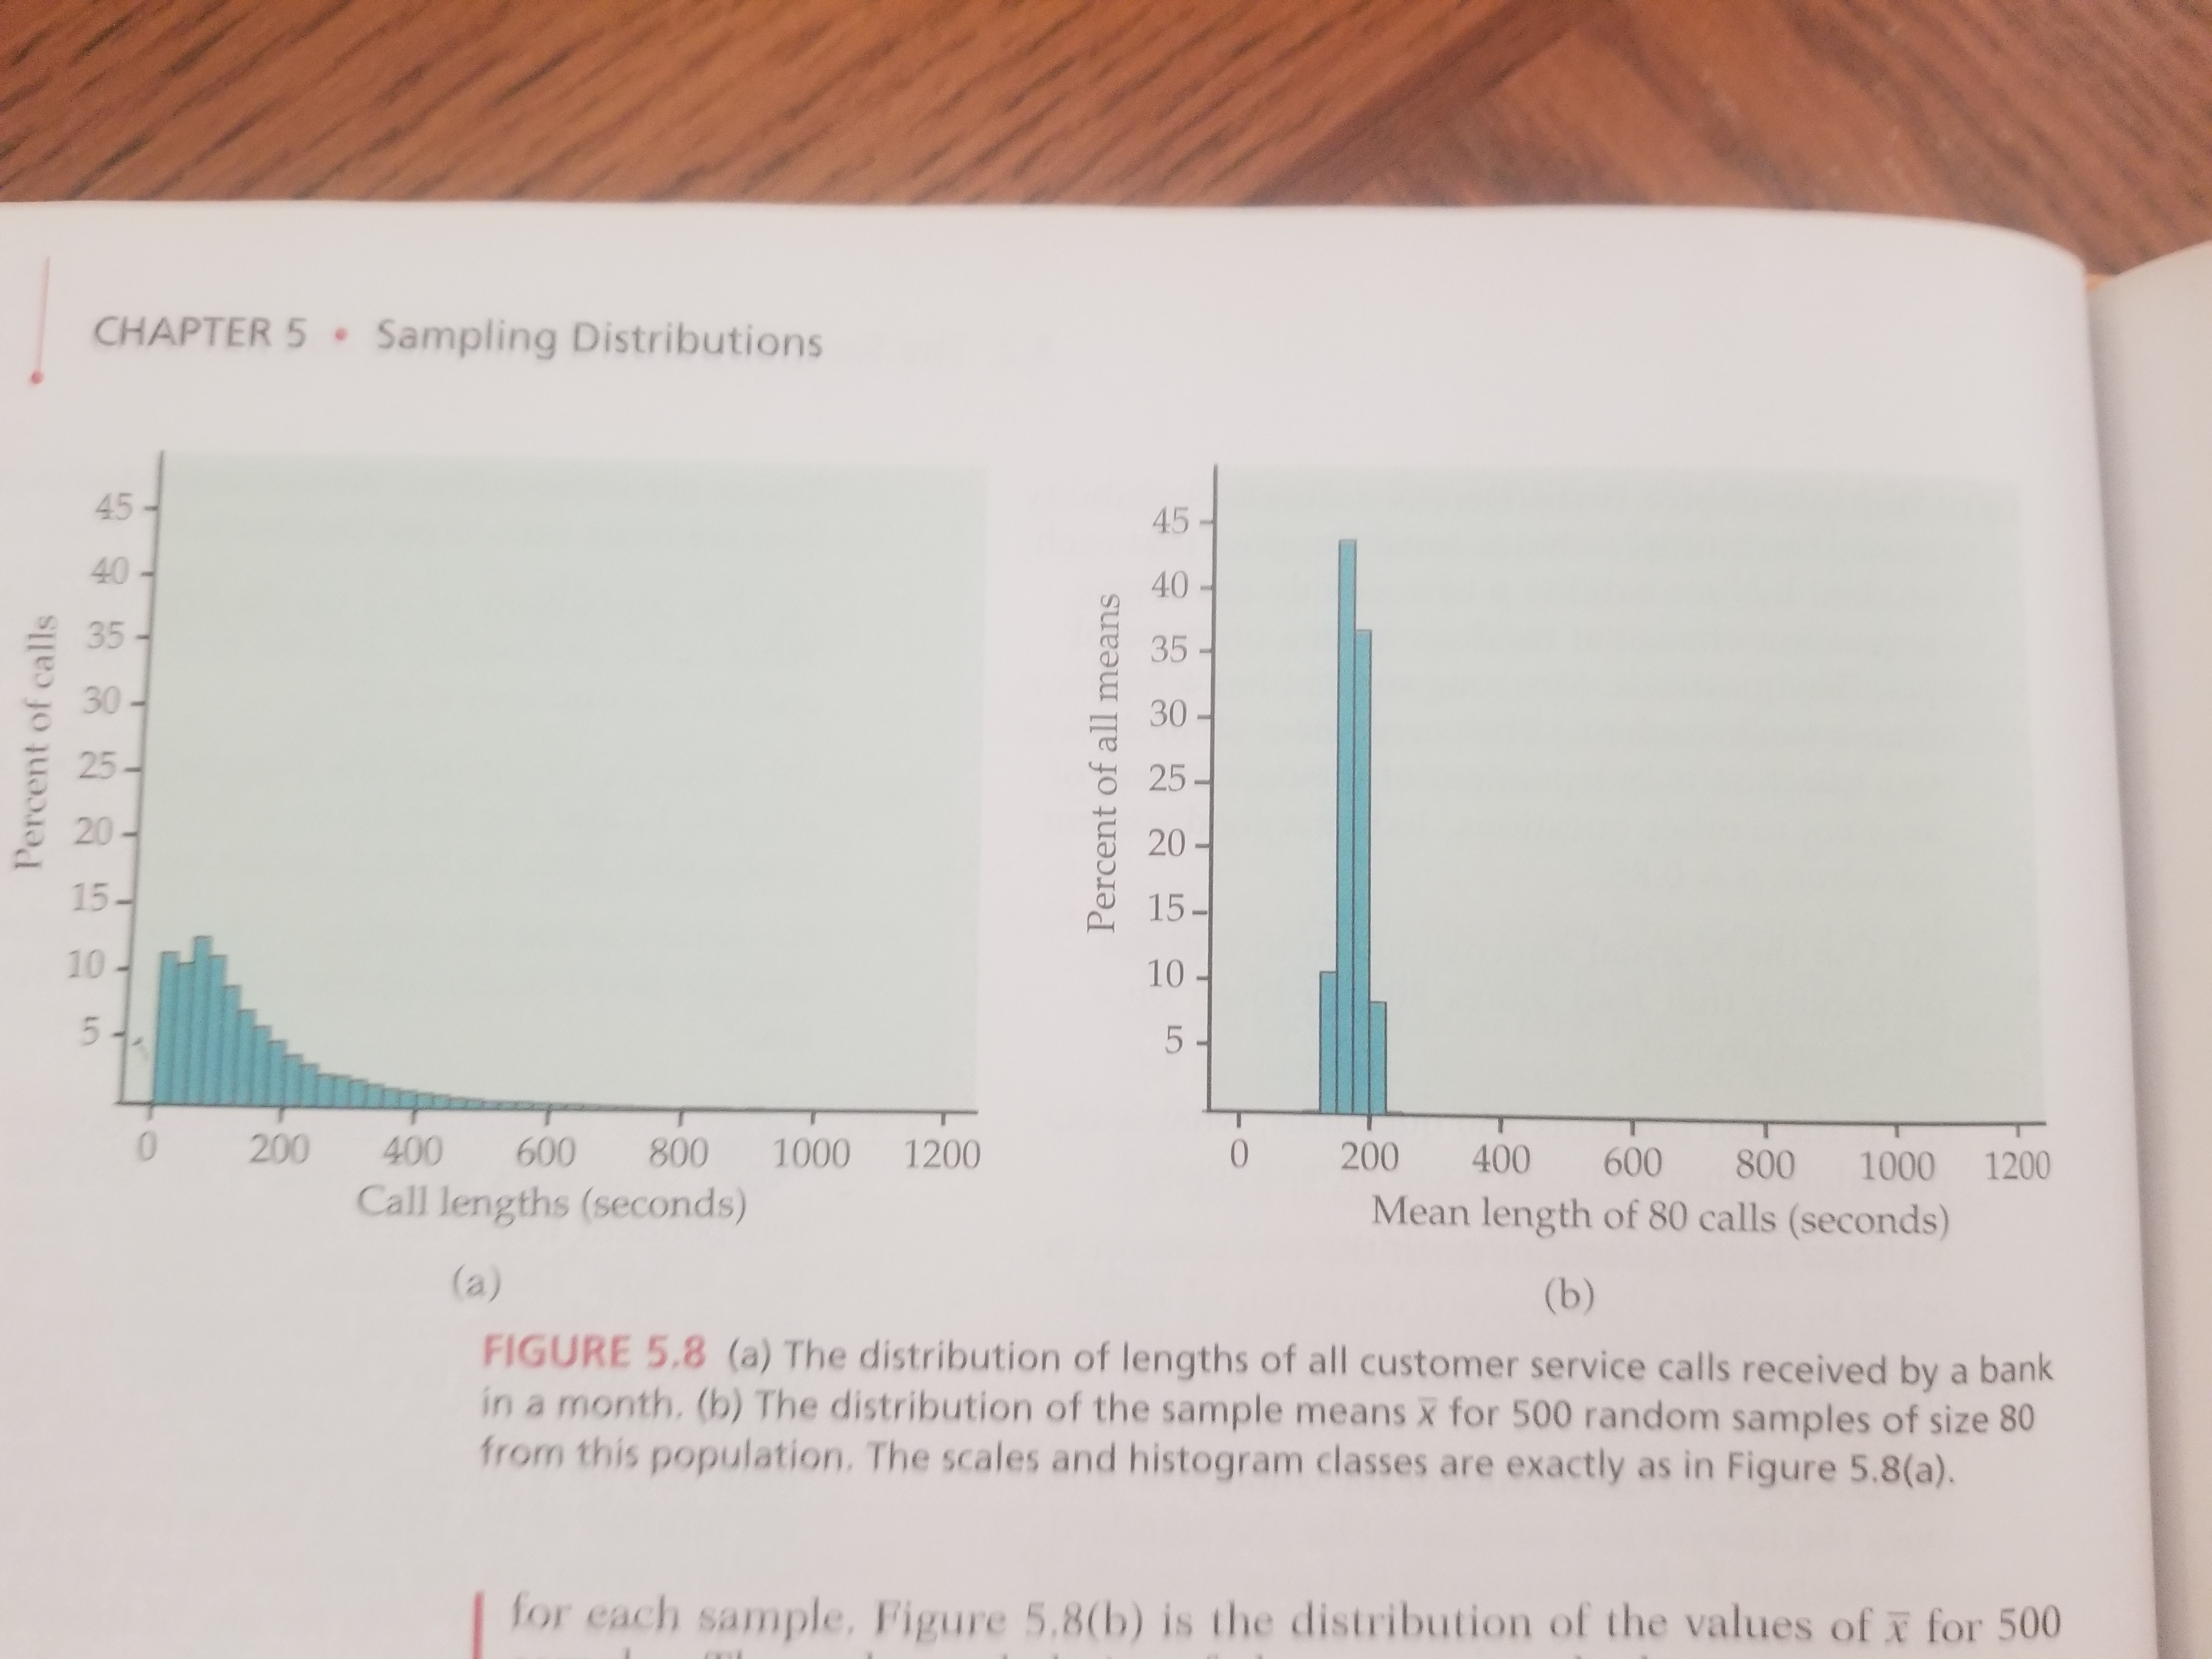
- Figure 5.8 on p. 336:
- Example 5.18 on p. 338

- Central Limit Theorem
- Simple random samples of size n from any population with mean μ and finite standard distribution σ. When n is large (typically ≥ 30), the sampling distribution of the sample mean is approximately Normal.
- Example 5.19 on p. 339
- Video

Activity:
- Test the Central Limit Theorem
- Calculate sample means (use Vehicle Year)
- Report results
Study:
- For practice complete Exercises 5.36, 5.37, 5.38, 5.39 on pp. 336-340
- Read pp. 335-344, Sampling Distribution
| Mean | 2007.65 |
| Standard Error | 0.63 |
| Median | 2006.50 |
| Mode | 2013.00 |
| Standard Deviation | 5.77 |
| Range | 23.00 |
| Minimum | 1996.00 |
| Maximum | 2019.00 |
| Sum | 168643.00 |
| Count | 84.00 |
| Largest(1) | 2019.00 |
| Smallest(1) | 1996.00 |
| sampling distribution mean | 2007.65 |
| sampling distribution stdev | 0.63 |