Lesson 4: Measuring Variance and Standard Deviation
September 4, 2019
Review:
- Measures of Center
- Boxplots
- Alternative for boxplots: http://www.imathas.com/stattools/boxplot.html
- Attendance
Presentation:
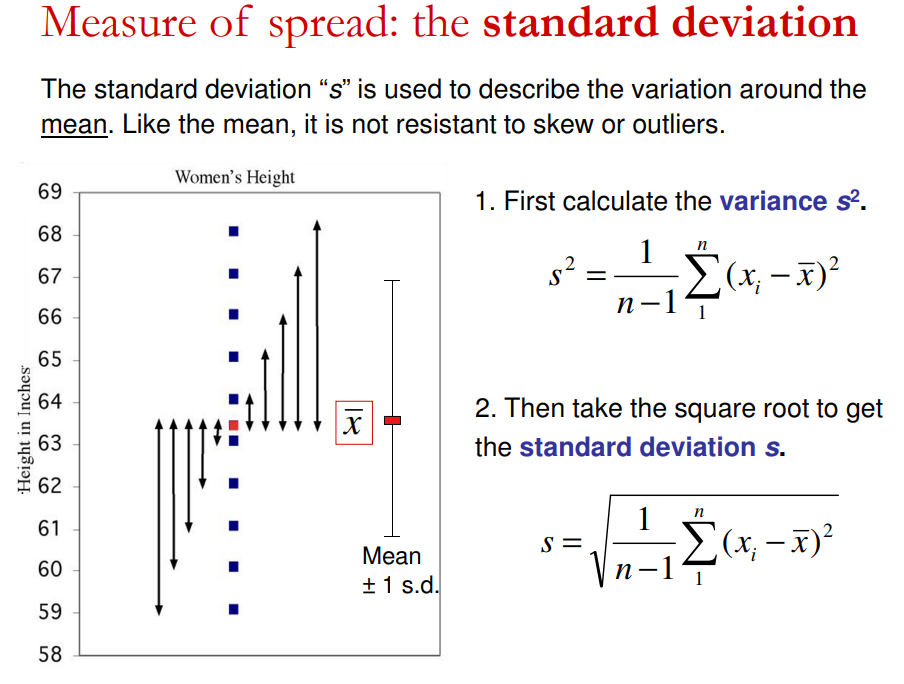
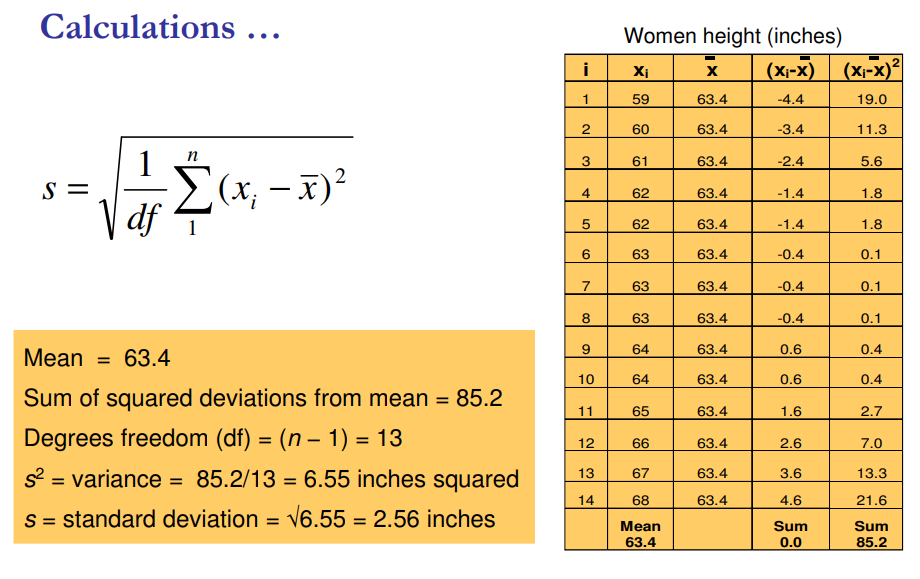
- Demonstrate calculation
- Find the variance and the standard deviation for the following (n=10) exam scores: 80 73 92 85 75 98 93 55 80 90
- Demonstrate in Google Sheets
- Video
Activity:
Problem 1. Below are the number of home runs that Babe Ruth hit in each of his 15 years with the New York Yankees, 1920 – 1934. Calculate the mean and standard deviation.
54 59 35 41 46 25 47 60 54 46 49 46 41 34 22
Problem 2. Six 9th-grade students and six 12th-grade students were asked: how many movies have you seen this month? See their responses below. Calculate the mean and standard deviation for each data set. Which is more spread out, the 9th-grade or 12th-grade data?
9th-grade: 5, 1, 2, 5, 3, 8
12th-grade: 4, 2, 0, 2, 3, 1
Assignment:
- Repeat Problems 1 and 2 (above) using Sheets
- Using the Student Height Data, calculate mean and standard deviation in Sheets
- Text Ch. 1, p. 40-44