Lesson 4: Exploring Time Series Data
January 22, 2020
Review:
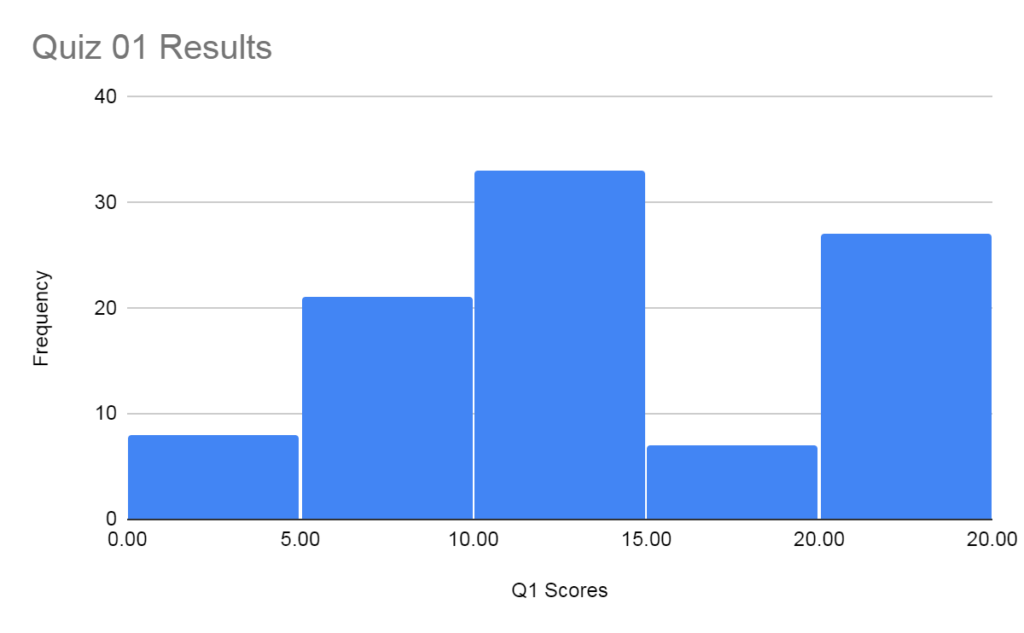
- Quiz 01 Results

- Simple Regression
- PEARSON()
- LINEST()
Presentation:
- Time Series Data
- Line Plots
- Stock Charts
- Yield Curve
- Trendlines
Activity:
- Build Line Charts to visualize historical Oil and Gold price activity
- GoldPrices
- Where do you think prices are headed for 2020-2021?
- Challenge:
- Are Oil and Gold prices correlated?
- Calculate the Pearson Correlation Coefficient.
Assignment:
- Study for Quiz 02
- Simple Linear Regression
- Time Series data
- Line Plots