The Bell Game
September 24, 2014
This Friday at 7pm Centennial High School and Central High School will meet at Dutch Clark Stadium to play the 114th game in their historic football rivalry, dating back to 1892. I’m not sure if it’s true but The Bell Game is thought to be the oldest High School Football Rivalry west of the Mississippi River.
As a Pueblo resident, it’s the biggest local sporting event of the year and a wonderful community tradition. Dutch Clark will be packed with fans wearing Red for Centennial or Blue for Central. I’ll bet for many who attend it’s the only live sporting event they go to all year. The Bell Game is special and it’s part of what makes Pueblo a unique and wonderful place to live.
On Tuesday, the Pueblo Chieftain wrote an article about the Bell Game and printed a list of the 113 games played with final scores through the years. As a data visualization person, I wanted to see something more colorful so I produced the following graphic to commemorate the 114th Bell Game. No scores because the only thing that matters is who wins. Hope you like it!
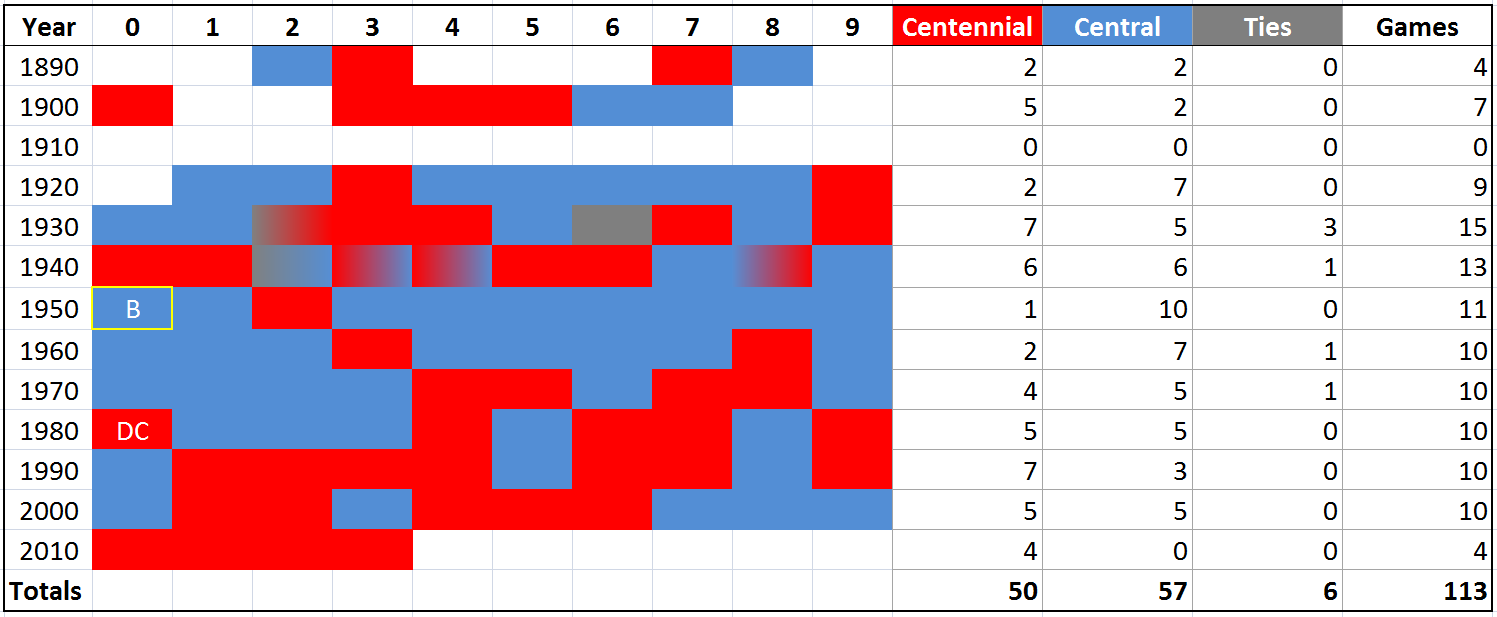
A few notes. The first actual “Bell Game” (winner awarded the Bell until the following year) was played in 1950 (denoted by the gold outline and “B”). In 1980 the Pueblo Public School Stadium was renamed “Dutch Clark” Stadium commemorating the legendary Central High School graduate and NFL Hall of Fame inductee (denoted by “DC”). In the 1930s and 1940s more than one game was played in some years, represented in the graphic by a color gradient as appropriate (tie games shaded grey).
Central leads the all-time series 57-50-6. Central also leads the Bell Game series 34-28-3. Centennial leads the Dutch Clark Stadium era series 21-13-0.
As a 1986 Centennial High School graduate, I’ll be sitting on the east side of the stadium, wearing red and singing “On Centennial” each time the marching band strikes up the old fight song…or at least until my kids tell me to shut up.
Go Bulldogs!
2 Comments
I love this chart! It is just what I was looking for. I know that WWl was 1914-1918, but any idea why there are no statistics for the other years between 1910 and 1921?
Go, Bulldogs!
[…] year I wrote a post in preparation for the 2014 Bell Game and produced a graphic illustrating the rivalry’s glorious history. This year I’ve […]