Aftermarket Pulse
Beginning in April 2020 I began writing a series of white papers in which I analyze Repair Order (RO) data provided by Full Throttle Technologies. We’re calling this series the Aftermarket Pulse. I will post each issue here.
Category: Predictive Analytics
Beginning in April 2020 I began writing a series of white papers in which I analyze Repair Order (RO) data provided by Full Throttle Technologies. We’re calling this series the Aftermarket Pulse. I will post each issue here.
Beginning to track Covid-19 Cases in Colorado by County
No longer providing additional commentary, it’s too grim. But still updating these two charts: Cases per million and Total Cases
Update 10:00a March 20
Colorado has made some nice improvements and I can now recommend a visit to https://covid19.colorado.gov/data. I still think the numbers are way too low versus reality but the reporting has improved a lot. They’re reporting 277 cases as of yesterday. My model suggests the number of cases is around 700.
In the US, number of cases jumped to 10,442 yesterday but already this morning I’m seeing 14,250 on this JHU dashboard. This is in line with my more aggressive model prediction of 13,781 cases for today.
Update 6:38p March 18
US Cases now 7,769. My prediction for today, based on the original model, was 7,203. My original prediction for tomorrow was 8,877; my new prediction for tomorrow, including more recent figures, is 9,946. The actual number is almost certainly a lot higher.
Colorado is not keeping up. They have a dedicated site at https://covid19.colorado.gov/data but total cases posted is 216, up only 32 from 184 yesterday. I think maybe they have their heads in the sand or they just have bigger fish to fry. My model suggests the current number is closer to 500 and tomorrow it should be ~700.
Update 6:25p March 17
Number of US cases is now up to 6,423 (even higher than predicted!). Colorado is not reporting a different number, they still say 160, but one news outlet reported 183. I’m pretty confident the number will go up sharply next time the Colorado Dept of Public Health posts a meaningful update.
Original article:
I’ve been downloading data from a GitHub repository maintained by the John Hopkin’s University Center for Systems Science and Engineering and I’ve decided to try forecasting the number of confirmed cases in the US and in the State of Colorado.
Here’s a link to the data and my very simplistic exponential models: COVID-19 Models
As of March 16 the US has 4,632 confirmed cases. I project the number of cases will jump to ~5,800 cases tomorrow (3/17) and ~25,200 cases in one week (3/24).
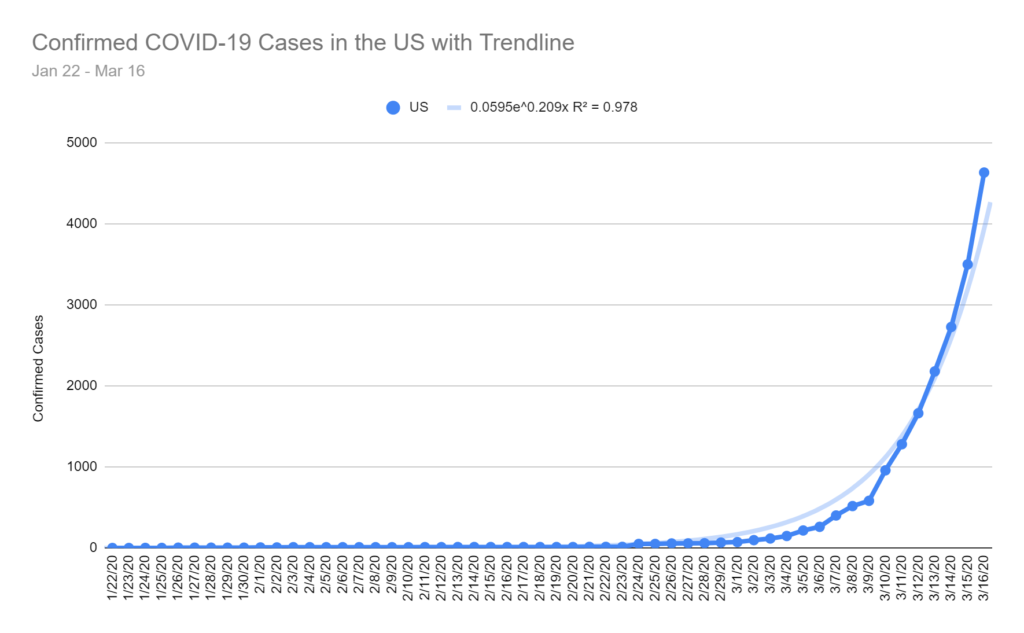
In Colorado, there are currently 160 confirmed cases. I project the number of cases will jump to ~350 cases tomorrow (3/17) and ~4,000 cases in one week (3/24).
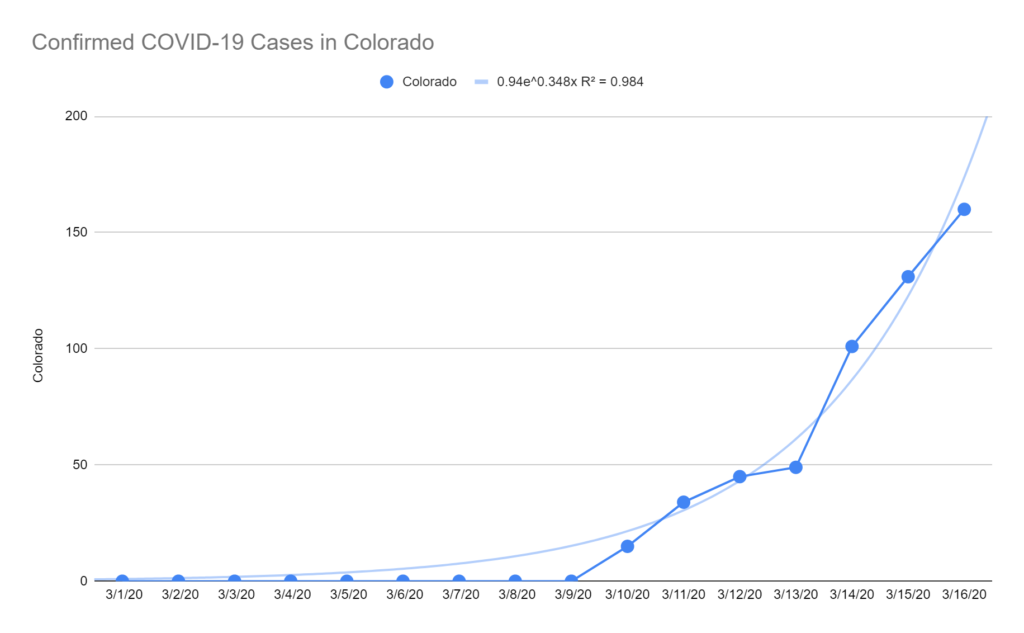
I hope both of these forecasts turn out to be way too high. We’ll see how it goes. Hang tight, friends.
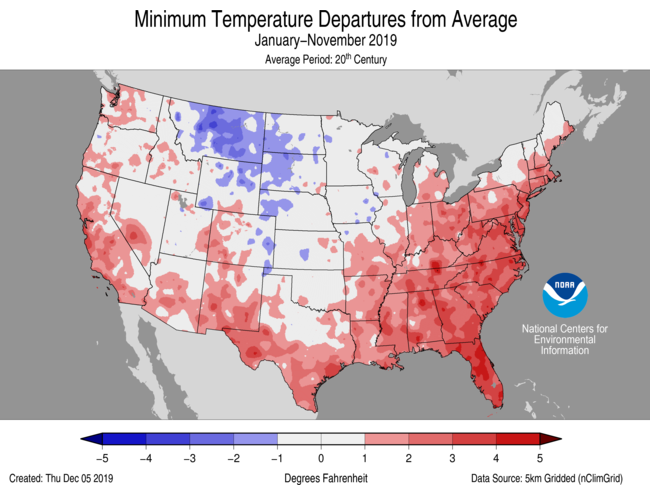
The map above shows temperature anomalies across the Conterminous US for calendar year 2019 through November. These anomalies relate specifically to daily Low temperatures. Where you see red, daily low temperatures were warmer than 20th Century averages (darker reds indicate much warmer daily low temps). Generally speaking, 2019 has been a much warmer than average (vs 20th Century) year, especially in the Eastern US and along the Pacific, Gulf and Atlantic Coasts (where the vast majority of Americans live). The Northern Rockies, Dakotas and western Great Plains areas have seen cooler temperatures but this isn’t as significant for most consumer products businesses because there aren’t as many people in the region.
Why look at daily low temperature anomalies? There could be many reasons but one reason is that some consumer products sell a lot more or a lot less depending on weather. For example, the starter motor in your car is far more likely to fail when the nightly low temperature is really low. So, companies in the automotive aftermarket are accustomed to selling lots of starters in the late fall and winter months when temperatures plummet.
But, what if they don’t plummet? Well, that might lead to lower sales volumes for the starter produce category. It might also leave a lot of starter inventory sitting on shelves at distribution centers. In other words, this can have a major impact on the starter motor supply chain. This appears to be the case in a large portion of the Eastern US where aftermarket companies may have expected lower sales due to milder overnight low temperatures.
And, that is exactly why Aftermarket Analytics is now offering a Climate Data Portal as part of our analytical services for the automotive aftermarket.
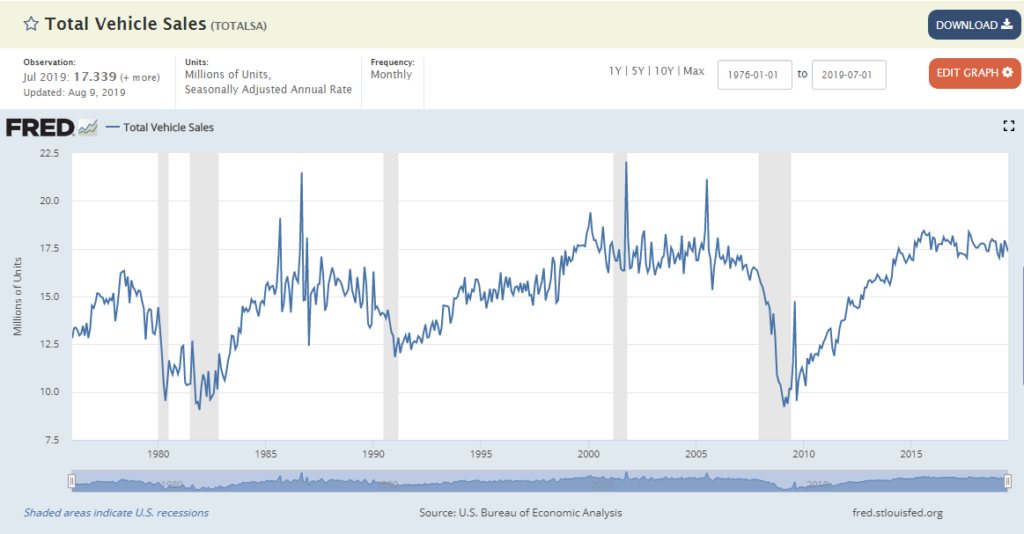
This line chart (from the St. Louis Fed website) is one I’ve looked at many times. It tells an interesting story.
It shows monthly new car sales volume in the US going all the back to Jan 1976. Along the horizontal x-axis we have the monthly time series beginning Jan 1976 on the left moving through time until the present with last month’s car sales on the far right. Along the vertical y-axis we see new car sales volume in millions. In Jan 1976 the annual rate of new car sales, seasonally adjusted, was approximately 12.8 million. More generally, car makers were selling about 14-15 million units annually during the late 1970s. Last month, Jul 2019, the seasonally adjusted annual rate was approximately 17.3 million units, which is about where it’s been for the past 5 years. It’s been a roller coaster ride but for the domestic automotive industry volume is only up 15-20% over more than 40 years. Thankfully for the industry global growth has more than made up for relatively stagnant domestic sales.
The line chart includes shaded areas corresponding to economic recessions. You can see the dual stagflation recessions in 1980 and 1981-1982. You can see the recession in the early 1990s coming on the heels of the S&L Crisis. You can see the 2001 recession following the bursting of the Tech Bubble and you can see the recent Great Recession of 2008-2009 following the collapse of the housing and mortgage markets. Obviously, recessions aren’t great for new car sales. Usually, sales volumes decrease; sometimes they drop precipitously. It’s hard to miss the way new car sales fell off a cliff in 2009.
How is this relevant a decade later? In the Automotive Aftermarket it’s extraordinarily relevant because the “sweet spot” for automotive parts suppliers, distributors and retailers is about 10 years, more or less depending on the part category. So, while most of the economy has moved past the calamity of 2008-2009 recession, the Aftermarket is still dealing with the fallout. On the flip side, during the next decade the US aftermarket industry should experience growth mirroring the upward slope we see between 2010 and 2014. For investors or entrepreneurs looking for a silver lining in recent market volatility and increasing fears of a recession, the automotive aftermarket could provide a nice counter-cyclical investment opportunity.
I just published a blog post about the future of VIO data (VIO stands for Vehicles In Operation; think census of registered cars, SUVs, light trucks, etc) over at aftermarketanalytics.com.
Here’s a link to the post: https://aftermarketanalytics.com/2018/05/15/the-future-of-vio/
Please take a look if you’re interested and share!
In the past year, Aftermarket Analytics has been working hard to bring a new product to the Automotive Aftermarket. The new product, Inventory Analyst (IA), is a web service or software-as-a-service (SaaS) designed to provide an easy-to-use solution for part-level demand forecasting. Rather than trying to explain what that means I want to share with you a new video we’ve produced to demonstrate how the software works and how easy it is to use. This is less of an advertisement and more of an instructional/educational introduction to the software.
The video was produced by our new Director of Sales & Marketing, David Taylor. Take it away, David!
There will be more videos to come, so stay tuned.
I want to add that I couldn’t be more proud of my small team who made this happen. Shout out to Chris Harman who leads software development and Bobby Valentine who leads data science. I couldn’t hope for two better technology gurus and team leaders. Their overlapping teams include Michael DeGraw, Brian Hicks, Christian Bundy, Sean Fitzgerald, Yassin Bahid, Alex Marck and, before her recent retirement, Nancy Hamilton. I also want to thank David Taylor for leading our sales and marketing efforts (his work is just beginning) and Nicole Heyn who keeps all the administrative pieces of the puzzle together. Thank you all!
For several years we’ve been operating successfully as a custom software development and analytics solution provider. This represents our first effort to bring an industry solution to market so we need all the help, good vibes, karma and feedback we can get. If you have any feedback on this video, the software or how we might reach as many potential users as possible, please leave a comment here (or send me a private note using the Contact form below). If you know someone in the automotive world, especially in the automotive aftermarket, please share this with them so we can continue to learn, improve and provide extraordinary value.
Our mission is to build world-class software to help companies in the automotive aftermarket deploy inventory as efficiently as possible. In doing so, we hope to also make a very small dent in the aggregate consumption of energy and materials and take a very small step toward building a more sustainable economy.
Oh yeah, we also want to build a great company and create excellent jobs in our hometown of Pueblo, Colorado. We’re always looking for great people to join our team. Let me know if you think you might be able to help.

Mark your calendars!
I will be one of the featured speakers at the 2015 Automotive Aftermarket Suppliers Association Technology Conference.
If you happen to be in Clearwater, Florida on September 22 stop by to say hello.
I recently read an OpEd piece in the New York Times, Eight (No, Nine!) Problems with Big Data. The article was written by two NYU professors, one a psychologist and one a computer scientist. I was looking forward to some interesting new arguments and points of view. I was in for disappointment.
Here is an abridged version of the 9 problems they see with Big Data.
Let’s take a look at these one at a time.
Problem #1 is straight from the Statistics 101 textbook: correlation does not imply causation. So big data in the hands of someone who never studied statistics could be a problem. Of course this has always been an important axiom for data analysts. Nothing new or significant about this problem with the advent of big data.
Problem #2 reminds us that we will still need biologists and other scientists with specific domain expertise because big data can’t do the job on its own. Yes, despite coordinated efforts, statisticians and computer scientists have failed to supplant all other scientific disciplines and domain expertise will continue to be valuable. Again, this issue predates use of the term big data.
Problem #3 warns us that if someone builds a tool with a simple algorithm (e.g., grading papers by looking for use of sophisticated words) then people will be able to figure it out. Darn it. You mean that feeble attempts at laziness might not work…even with big data? I’m starting to see a pattern here.
Problem #4 is clearly alarming. Google’s Flu Trends doesn’t seem to work well any longer. It was so cool at first. And, now, the whole internet has changed. Jeez. Why would the internet change? It’s sort of like analyzing people and finding a way to predict behavior and then those people change their behavior. Why do they do that? It’s a horrible dilemma but we seem to be stuck re-analyzing data over and over to keep track of changes. Brutal. Why doesn’t big data fix that?
Problem #5 implies that before big data no one ever created a model with data they collected on their own and then failed to validate said model with a 3rd party independent source. In other words, model validation is still important. Yes, again, even with big data. Damn it!! I still have to pay attention!
Problem #6 is a major issue if you don’t know anything at all about statistics or data analysis – just like problem #1. The issue here though is that there are correlations everywhere because there is simply too much data analysis going on. Were we better off when we only analyzed a few data sets? I don’t really get this one and I’m surprised the computer science professor allowed this to go to print. Doing more data analysis doesn’t prevent bad interpretation but it doesn’t hurt anything either.
Problem #7 is the anti-positivist angle. Talk to any social scientist who hated math or statistics. They refer to any effort to quantify as “positivism” and lump this sort of research into a bucket full of other horrible practices like voter discrimination and other parts of the GOP platform. (Aside: if you didn’t go to grad school imagine a chain smoking, hand-waving intellectual want-to-be who uses big words but on the inside is terrified they’ll be discovered as not terribly insightful.) I’ll bet the computer scientist secretly liked seeing Francis Scott Key as #19 on the poet list. Who says he’s not a poet? But, the psychologist doesn’t want us to forget that humans have a right to make arbitrary distinctions between those who rhyme with spoken word versus those who rhyme with lyrics to music. To me, these efforts can provide uniquely useful insights. Sometimes they must be disregarded as whimsical but not always. And what’s wrong with a whimsical perspective from time to time?
Problem #8 is sort of like … well, we really want to get to 8 or 9 problems. That’s a big number and that way no one will really want to read the entire article because there are so many problems they will simply assume we’re correct and move on to the next article. Big data is good at analyzing “common” things? What does that mean? So big data is good for analyzing baseball and apple pie but it’s bad for analyzing tennis and zucchini bread? There are rules about how much significance can be attributed to inferential findings – again this is Stats 101..okay, maybe Stats 102 – but there’s nothing problematic about looking for a needle in a haystack. The example they give, something to do with translating a book review, has nothing to do with big data and everything to do with the thorny task of language translation. This may come as a shock but “big data” is better with numbers than it is with text.
Problem #9 – too much big data hype? Perhaps. To me, it’s very exciting that advances in computational power allow us to explore possible solutions to problems that were intractable just a few years ago. Maybe Big Data today is like disco in the 1980s. The Bee Gees were hot but popularity faded a few years later. Or maybe it’s more like the internet in the 1990s. There was way too much hoopla. Remember pets.com? What a joke. After 20 years the internet hasn’t really lived up to the hype…well, except now I work from a home office using a Google Chromebook purchased on Amazon. And you’re reading this on my blog.
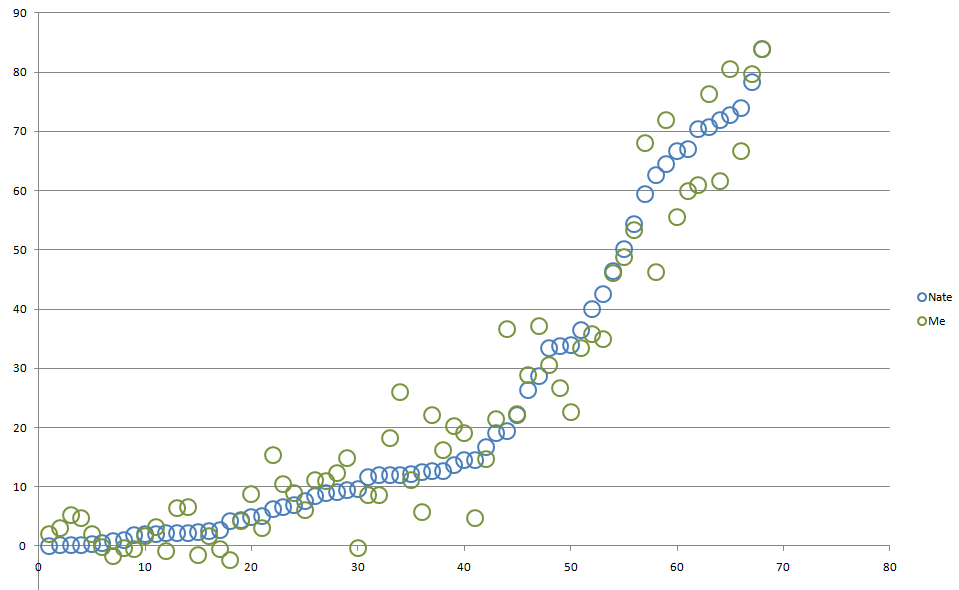
As part of the Advanced Statistics Class I’m teaching this term, I’ve asked students to build a regression model attempting to replicate Nate Silver’s March Madness Sweet 16 Predictions.
Nate’s model is built using a variety of factors:
Nate also makes adjustments for injuries and travel distance but we didn’t have time to include these factors in class.
In preparation for class today I built a model using only two variables: NCAA Seed Order and Sonny Moore’s ratings and was able to reproduce Nate’s % Chance of Reaching Sweet 16 with a fairly high level of accuracy. For stats nerds here is some model output:
| Regression Statistics | |
| Multiple R | 0.9694 |
| R Square | 0.9398 |
| Adjusted R Square | 0.9370 |
| Standard Error | 6.3795 |
| Observations | 68 |
| ANOVA | |||||
| df | SS | MS | F | Significance F | |
| Regression | 3 | 40662.94 | 13554.31 | 333.05 | 0.00000000 |
| Residual | 64 | 2604.68 | 40.70 | ||
| Total | 67 | 43267.62 |
I don’t want to share the regression equation itself because that might ruin the fun for my students. But, here is a comparison chart showing my predictions versus Nate’s along with the raw data further below. You are welcome to use these data for the Billion Dollar Bracket Challenge. All I ask is if Warren Buffet sends you a big check please send me half. Might cover a small portion of the college tuition expenses for my 3 kids over the next 15-20 years.
| Team | Nate | Me | Residuals |
| Florida | 83.9460 | 83.8147 | 0.1313 |
| Louisville | 78.3270 | 79.7111 | -1.3841 |
| Michigan | 73.8490 | 66.7303 | 7.1187 |
| Arizona | 72.6880 | 80.4752 | -7.7872 |
| Wisconsin | 71.8360 | 61.6824 | 10.1536 |
| Virginia | 70.7820 | 76.3386 | -5.5566 |
| Duke | 70.4410 | 60.9141 | 9.5269 |
| Kansas | 67.0390 | 59.9023 | 7.1367 |
| Michigan State | 66.5930 | 55.4831 | 11.1099 |
| Villanova | 64.4580 | 71.9180 | -7.4600 |
| UCLA | 62.6920 | 46.1987 | 16.4933 |
| Wichita State | 59.3560 | 67.9480 | -8.5920 |
| Creighton | 54.3760 | 53.2811 | 1.0949 |
| Syracuse | 50.1450 | 48.7612 | 1.3838 |
| Iowa State | 46.3800 | 45.9931 | 0.3869 |
| San Diego State | 42.5320 | 34.9598 | 7.5722 |
| Ohio State | 40.0770 | 35.8186 | 4.2584 |
| North Carolina | 36.3760 | 33.4644 | 2.9116 |
| Kentucky | 33.9020 | 22.6230 | 11.2790 |
| Baylor | 33.8120 | 26.6866 | 7.1254 |
| Oklahoma | 33.3590 | 30.5882 | 2.7708 |
| Virginia Commonwealth | 28.6660 | 37.0897 | -8.4237 |
| Connecticut | 26.3150 | 28.9027 | -2.5877 |
| New Mexico | 22.1610 | 22.2339 | -0.0729 |
| Cincinnati | 19.4840 | 36.6941 | -17.2101 |
| Oregon | 19.1420 | 21.3953 | -2.2533 |
| Memphis | 16.6600 | 14.6652 | 1.9948 |
| North Dakota State | 14.5470 | 4.7441 | 9.8029 |
| Oklahoma State | 14.4280 | 19.1470 | -4.7190 |
| Pittsburgh | 13.6190 | 20.2434 | -6.6244 |
| Gonzaga | 12.6190 | 22.0542 | -9.4352 |
| Texas | 12.6190 | 16.2179 | -3.5989 |
| Arizona State | 12.5200 | 5.6537 | 6.8663 |
| Providence | 12.1140 | 11.0555 | 1.0585 |
| St. Louis | 12.0300 | 25.9545 | -13.9245 |
| Tennessee | 11.9940 | 18.3063 | -6.3123 |
| George Washington | 11.9910 | 8.6488 | 3.3422 |
| Harvard | 11.6070 | 8.6408 | 2.9662 |
| New Mexico State | 9.5620 | -0.3737 | 9.9357 |
| Iowa | 9.3960 | 14.8457 | -5.4497 |
| Nebraska | 9.1640 | 12.2987 | -3.1347 |
| Stanford | 8.9180 | 10.9164 | -1.9984 |
| Saint Joseph’s | 8.3540 | 11.1070 | -2.7530 |
| Dayton | 7.6260 | 6.1262 | 1.4998 |
| BYU | 6.9540 | 9.0155 | -2.0615 |
| Kansas State | 6.6050 | 10.5180 | -3.9130 |
| Massachusetts | 6.2340 | 15.3853 | -9.1513 |
| North Carolina Central | 5.1300 | 3.1089 | 2.0211 |
| Xavier | 4.8220 | 8.8253 | -4.0033 |
| Tulsa | 4.4580 | 4.2679 | 0.1901 |
| Stephen F. Austin | 4.1830 | -2.4063 | 6.5893 |
| Louisiana-Lafayette | 2.6470 | -0.4934 | 3.1404 |
| Manhattan | 2.5570 | 1.7351 | 0.8219 |
| Delaware | 2.3160 | -1.5629 | 3.8789 |
| North Carolina State | 2.2640 | 6.6363 | -4.3723 |
| Colorado | 2.2420 | 6.3846 | -4.1426 |
| Western Michigan | 2.1510 | -0.7670 | 2.9180 |
| American University | 2.0690 | 3.2675 | -1.1985 |
| Mercer | 1.9350 | 1.6642 | 0.2708 |
| Eastern Kentucky | 1.8820 | -0.5050 | 2.3870 |
| Wofford | 1.0120 | -0.3110 | 1.3230 |
| Milwaukee | 0.8740 | -1.6194 | 2.4934 |
| Coastal Carolina | 0.5670 | -0.1038 | 0.6708 |
| Weber State | 0.2660 | 2.1002 | -1.8342 |
| Albany | 0.1130 | 4.7816 | -4.6686 |
| Cal Poly | 0.0910 | 5.2246 | -5.1336 |
| Mount St. Mary’s | 0.0800 | 3.0392 | -2.9592 |
| Texas Southern | 0.0450 | 1.9538 | -1.9088 |

When it comes to forecasting the future I like to think of two quotes from one of the smartest people I’ve ever worked with (the quote may not be precise but hopefully you’ll get the idea).
1. Forecasts are always wrong.
2. Forecasts with longer time horizons are always worse.
David Simchi-Levi, brilliant MIT Professor and my former boss at LogicTools (now part of IBM), told me this in person and I’m pretty sure he’s expressed the same idea in one or more of his many now-famous supply chain related publications.
I thought of these quotes immediately when I read a special report published in November by the Automotive Aftermarket Supply Association titled, “Don’t Discount Miles Driven in Long Term Forecasts”.
In the article author Paul McCarthy argues that miles driven is a critical driver of demand for parts in the automotive aftermarket. And, while he acknowledges that miles driven has been flat or declining for the past several years, he points to the US Energy Information Administration (EIA) forecast for increased miles traveled as reason to look forward to positive future growth in the aftermarket.
Well, I hate to burst anyone’s bubble but I have to point out that no one should hang their hat on this growth projection. If I was running a manufacturing or distribution company supplying parts to the automotive aftermarket I certainly wouldn’t put any stock in this forecast and I definitely wouldn’t make any capital investments based on these numbers. Let’s take a closer look at the EIA projections.

According to the first chart (above) in the AASA report miles driven peaked around 2006-2007 (which makes sense) around 2700 billion miles and has been more or less flat since (also makes sense). But, the “good news” in the second chart is that miles driven will increase sharply adding about 1 trillion miles annually in the coming years. Well, when exactly will those additional miles start hitting the pavement? According to the second chart in the report (below) it looks like it will be real soon, like next year or the year after.

Great news! Let’s get ready for big sales numbers! Better ramp up production and stock more inventory!
Uhhh…in the immortal words of Lee Corso, “not so fast, my friend”.
When I looked closely at the EIA numbers I noticed a few things that might be a problem if you’re banking on total miles driven to be a growth driver for the aftermarket. If you look at the graphic below (click on it for a larger, easier to read version) you’ll see the EIA’s 2012 forecast on top and their 2010 forecast on bottom. I’ve shaded the forecast “Total VMT” for the next 5 years (2013-2017) in both charts for easier comparison. You’ll notice that in the 2012 numbers we aren’t expected to return to the peak VMT levels reached in 2007 (orange highlight) until 2017. You’ll also notice that between 2010 and 2012 the EIA moved their forecast date for reaching 3,000 billion miles from 2017 all the way back to 2023 (red highlight). No big deal – just an extra 6 years! That’s a lifetime in business.

The Federal Highway Administration also publishes a traffic volume report. Here’s a link to the September 2012 report. The chart below is on page 9 of the report and shows that miles driven has decreased since 2007 and is still in a downward trend. If you were a stock-trading chart reader I think you’d say that the upward trend that started as late as 1987 has clearly been broken. Miles driven could certainly go up from here but, as they say, “the trend is your friend” and it appears just as likely to me that they may be headed further south.

I don’t know why anyone would want to predict something like total miles traveled in 2035. What if we aren’t even driving cars in 20 years? Think about all the change we’ve seen just in the past 5 years. Do you think that Research in Motion may have been predicting growth in smart phones but failed to foresee the emergence of the iPhone and iPad? I’ve read that Google is working on self-driving cars. How will that change the way we transport ourselves? Will improvements in navigational efficiency thanks to ubiquitous mobile devices with GPS technology lead to a large reduction in miles driven? Will personal airplanes become economically viable in the next 15 years? Will communication technology continue to advance at such an amazing pace that virtual meetings become a far more reliable means of interaction allowing far more people to work from a home office? Or might it allow more people to shop or visit service providers (e.g., doctors, lawyers, psychologists, teachers, etc) in a virtual environment?
It’s way too difficult to predict that far out into the future. That’s why I prefer to look no further than 1-2 years out for business forecasting. Will miles driven increase in the next year or two? Perhaps but probably not by much. Will miles driven decrease in the next year or two? Perhaps but probably not by much. Will cars still be the primary mode of transport in 2 years? Yes. There you go. Three forecasts you can hang your hat on. Obviously those forecasts aren’t worth much. But, I would consider paying good money for a forecast of miles driven in Q1 and Q2 2013, especially if it were available by region.
So don’t worry about how many miles will be driven in 2015, let alone 2025 or 2035. No one really knows for sure. I can only safely guarantee two things: